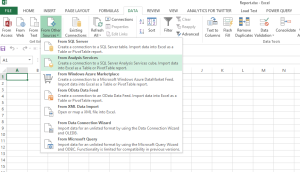
To explore the data that we stored in the cube we need to open an excel file and create a data connection to our cube. In order to do that we need to follow the next steps:
Go to the Data tab and in the “From other source” options choose From Analysis Services
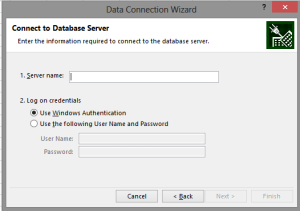
Indicate the name of your server instance
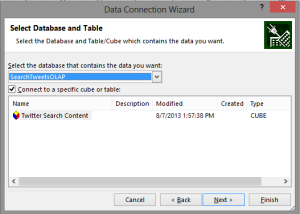
Select the cube that you want to use
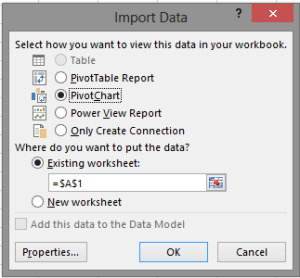
Now you can choose between insert a Pivot Table, a Pivot Chart or a PowerView Report, I will begin inserting a Pivot Chart
Using the right panel you can choose the measure and dimension you want to use in your charts.

These are some expamples of chart:
User more influents (base it in their amount of followers) that tweet about our search criteria

Number of tweets by month and year

Numbers of tweets by date

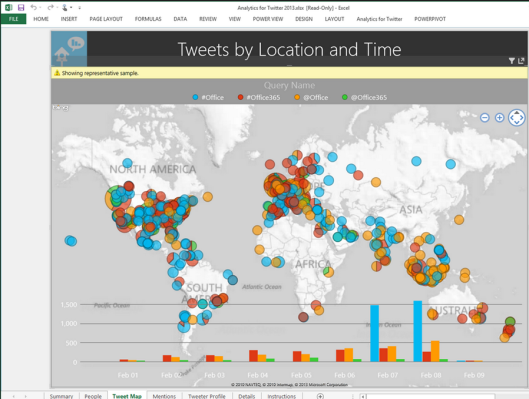
Numbers of tweets by location
We also can create a Power View report creating a Power Pivot Data Source, to do this go to the Power Pivot tab and click the Manage option.
Now we need to create a data connection


Click Design

Now drag and drop the measures and dimension properties that you want to use in your data source.


Click Finish

Now you can close the Power Pivot windows and in a new sheet go to the Insert tab and select Power View

Use the right panel to indicate the measure and dimension that you want to use on the report.
This are some examples:
Evolution of tweets by day (Using the scatter chart)

Amount of tweets by location (Using the map chart)


